Monday, May 13, 2013

High Altitude Balloon Launch

Introduction
The Geospatial Field Methods class at the University of Wisconsin-Eau Claire had worked throughout the semester to develop a High Altitude Balloon Launch (HABL) rig.  The rig was created with a styrofoam box with a hole to fit the lens of a flip camera, a GPS tracker to retrieve the mapping rig and hand warmers to protect the flip camera from the cold temperatures of higher altitude.  The styrofoam box with its contents was taped shut with strong packing tape.  A parachute was attached the the mapping rig so when the balloon popped from increased air temperature the camera and GPS tracker would be protected.

Methods
The class worked on preparing the High Altitude Balloon mapping rig throughout the semester. The construction of the rig can be seen in "Balloon Mapping Part I" as well as other student blogs at http://people.uwec.edu/hupyjp/webdocs/geog336_Reports_spr13.htm.

On April 26th, 2013 the class, along with Professor Joe Hupy, launched the High Altitude Balloon rig.  On the day of the launch an 8 foot diameter balloon was filled with helium.  When the balloon was full, the balloon rig and parachute were attached.  The Balloon rig was launched from the center of the University of Wisconsin-Eau Claire campus at approximately 8:30 a.m.  The temperature at the launch time was in the mid-60s and the wind was slightly mild.  The conditions were not perfect, but sufficient for the balloon launch.  The balloon rose quickly to the east on its release.  The HABL rig reached around 100,000 feet in the air.  When the balloon was out of site, students went into the classroom and waited for a signal from the tracking device.
After about an hour, the signal was received.  The balloon rig had landed about 78 miles from campus near Marshfield, Wisconsin.

Figure 1: High Altitude Balloon Launch
Path of Balloon


Figure 2: High Altitude Balloon Rig
Ending Location Near Spencer, Wisconsin


Discussion
Some aspects of this project could be improved for better results.  The Flip camera shut off and stopped collected imagery after only an hour.  Luckily for us, the balloon had already started descending at that point.  A GoPRO camera would be a better camera type to use for the purposes of this type of mapping.  As the camera rose in the atmosphere condensation formed around the camera lense.  This resulted in somewhat hazy images.  In future HABL launches a kite may be used and a thermometer and barometer may be added to the rig for more data collection during the balloon's flight.

The images collected from the HABL launch are somewhat shaky and are at inconsistent angles.  Because of this, the best images from the HABL launch are static images.

Conclusion
I had never considered collecting aerial imagery using this technique before this class.  I am thankful that through Professor Joe Hupy I was able to participate in such an innovative process.  There are many unconventional ways of mapping and aerial imagery; with creativity amazing images can be retrieved at a very low cost.

Trial and error was very important to the success of this project.  Throughout the semester and by the campus balloon mapping exercises we were able to come up with new ideas to create better aerial imagery mapping devices.  Even after the HABL launch the class thought of ideas of how we could have made it better.  The collaboration as a class was my favorite part of this project.  The ideas that were thought of were expanded upon by other students.  It helped me to open my mind to things I had never thought of before.

ArcPad Data Collection

Introduction
The goal of this project was to develop a deployable database to be used to collect data in the field.  The database consisted of pre-designated fields and domains.  Once the database was developed, it was deployed to a Trimble Juno GPS unit and data was collected at The Priory.

Methods

The first step in the project was to determine what data to collect.  Students chose from trails, benches, erosion points, notable viewpoints, large trees, notable trees, dead trees, human objects, bluebird houses and animal tracks.  Our group chose to collect data on notable trees; this included large trees, small trees, notable trees and dead trees.

In ArcCatalog, a new file geodatabase was created.  Domains for tree condition, tree type and notable features for trees.  Coded values were used within the domains for efficiency of data collection in the field.  The coordinate system for the geodatabase and feature class was set for WGS 1984.  This is the coordinate system used by the Trimble GPS unit.


Figure 1: Domain types in geodatabase developed for
field collection of trees at The Priory
After the geodatabase was collected and all attribute fields were added, the database was deployed to a Trimble Juno GPS data.  To ensure the geodatabase would not be corrupted, the entire folder holding the geodatabase ("CheckInOut_Hansonla") was copied.  The folders when then copied and pasted into the storage card on the GPS unit.


Figure 2: Folder hierarchy to be deployed
to Trimble Juno GPS unit

Once the geodatabase was deployed the the GPS unit, we went to The Priory to start collecting data.  Our group walked along the trails of the area and collected points of trees that had visibly notable features.

Results
During a two hour period of field collection, 14 data points were collected.  The following figure shows all of the data points collected.
Figure 1: Notable Trees, All data points collected
The Priory-Eau Claire, Wisconsin

Figure 2: Notable Tree Condition
The Priory-Eau Claire, Wisconsin
Figure 3: Notable Tree Size
The Priory-Eau Claire, Wisconsin
Figure 4: Trees with special conditions
The Priory-Eau Claire, Wisconsin
Figure 5: Tree Type
The Priory-Eau Claire, Wisconsin

Discussion
Although I have worked with deploying geodatabases to ArcPad in the past, I learned a lot of things through this exercise.  Unfortunately, two members of our groups geodatabases did not deploy to the ArcPad correctly.  One geodatabase did not deploy because the feature class and TIFF file were not projected to WGS 1984.  My geodatabase deployed to the GPS unit, but for an unknown reason it would not collect data.  It is my guess that the symbol I used for the feature class on the computer was not compatible with ArcPad.

Because two members could not collect data with their individual GPS unit, we used one GPS unit and took turns collecting data.  This was not the best way to go about such an exercise, but it worked.  It is obvious through the data collected that were did not collect things in the exact same way.  This can hamper the data collection.  This exercise was designed to introduce the students to geodatabase deployment and the Trimble Juno GPS units.  Even with the difficulties of our group, we were still able to learn the basics of both aspects of the exercise.

Sunday, April 21, 2013

Balloon Mapping & Mosaicing


INTRODUCTION
Our Geospatial Field Methods class constructed then launched a balloon mapping rig to collect aerial imagery of the University of Wisconsin Eau Claire campus.  The imagery was then georeferenced and mosaiced to  be used as an aerial map.

The class constructed the balloon apparatus prior out of a styrofoam cooler and  an empty soda bottle. A digital camera, tracking device and GPS were attached to the rig as well as a large weather balloon filled with helium.  A string was connected to the weather balloon and used to control the device


METHODS
The construction of the balloon mapping apparatus required careful preparation.  We had to measure each and every item used in the device so we knew how much the balloon mapping device would weigh.  

Figure 1- Students weighing each item used to
construct the balloon mapping device
Students tested and timed the parachute, constructed rigs for the balloon applications, determined the best camera for the launch and designed the implementation of the continuous shot (Figure 3) and tested the tracking device.
Figure 2- Implementing Continuous
Shot
Once the balloon mapping device was constructed, we filled the weather balloon with helium and measured the string to 400 meters.  We attached the string and balloon to the mapping device.  The next step was to launch the balloon mapping device.  This was done by unravelling the string until all 400 meters were unraveled.  Two students held the string connected to the balloon mapping device and walked around campus to collect aerial imagery of the area.  When we believed a sufficient amount of footage was captured and a sufficient sized area was covered the string was taken in so the mapping device was grounded.  The images were uploaded to a computer to be mosaiced together.

Two techniques were used to mosaic the aerial imagery; a website called mapknitter and georeferencing through ArcMap.

Mapknitter is a website that provides tools necessary to "knit" together aerial images to create a map.  A Google Imagery base layer was offered by the website.  This base layer could be used as a reference for the placement and scale of the imported images.  Once an image was uploaded it could be scaled and moved so it could be located in the correct position.  This was done repeatedly with numerous images until the images were sufficiently placed.


Figure 3: Aerial Imagery map created with MapKnitter (mapknitter.org)

The second technique was georeferencing with ArcMap.  Because there was such a large amount of images to be mosaiced, the class was divided into groups.  Each group created a mosaic of images of a certain area of campus.  Data was uploaded to a map document
 that would be beneficial to the process of georeferencing.  The data included a polygon feature class for my groups section and a CAD polygon feature class of the buildings on campus (Figure 4).  I used an imagery basemap provided by ESRI in the beginning of the process as a reference.
Figure 4- Group Section & Buildings feature classes

After this data was added the images were georeferenced to create a mosaic raster data layer.  Below are the steps necessary for georeferencing.

1.) Turn on the georeferencing toolbox
2.) Click the "Control Points Tool"
3.) Zoom to the current image
4.) Click a point on the current image that can be easily referenced to the buildings feature class
5.) Zoom to the Group Section layer
4.) Click on the area that matches the point previously selected on the current image

The image will move to a new location using the georeferenced point; do this repeatedly for each image until the image is placed in the correct area.  This process is repeated for each image until an area is accurately represented on the map.

The design of the mapping devices were improved upon and then implemented into the launches.  The class launched the balloon mapping apparatus multiple times so the improved devices could be used.
Figure 5: Final mosaiced raster dataset of the aerial images for section 4


Discussion
This was the first experience with balloon mapping for the students and professors in this class.  Trial, Error and Editing was crucial to the process.  The class analyzed each step of the process and fixed the problems that arose; doing so helped the class to find the best way to collect aerial imagery.  A fin was attached to the balloon mapping apparatus.  In my opinion the fin improved the device the most.  It helped manage the wind, so the images were collected at more uniform angles.

The first launch resulted in somewhat disastrous results.  Students took the device over the Chippewa River on a very windy day, the string snapped and the weather balloon was lost.  Luckily, the camera and tracking device were placed in a floatable box, so we were able to retrieve those objects.  The next time the balloon mapping device was launched the students reeled in the string while crossing the river so there was less tension on the string.

ArcMap 10.1 produced a better result and it was easier to georeference the images in this technique.  It was also a good resource to use because you could go back and edit the control points.  This wasn't available in Mapknitter, so if a project was greatly distorted you had to delete the image and start over.

The images taken from the balloon are not at a constant altitude or angle.  This makes it hard to match the images perfectly and some of the areas are distorted because of this.  To avoid this problem as much as possible, the images overlapped each other in many areas.  This problem can be seen in the area of the walking bridge and Schofield Hall in the final map.

Sunday, April 14, 2013

Aerial Imagery Mosaicing

Introduction
Our class has created and implemented a balloon mapping rig in the previous weeks.  This is an innovative and cost-effective way to collect aerial imagery.  In order to use the aerial imagery, the images collected by the balloon must be georeferenced and mosaiced.  This report concentrates on the process of both mosaicing and georeferencing images from our balloon mapping.

Methods

Two techniques were used to mosaic the aerial imagery.  For both techniques the images were uploaded to a desktop after the balloon was grounded.  The techniques used were very different; the first technique was using a website called mapknitter, the second technique was georeferencing through ArcMap.

Mapknitter is a website that provides tools necessary to "knit" together aerial images to create a map.  A Google Imagery base layer was offered by the website.  This base layer could be used as a reference for the placement and scale of the imported images.  The images had to be uploaded to the site one at a time.  Once an image was uploaded it could be scaled and moved so it could be located in the correct position.  This was done repeatedly with numerous images until the images were sufficiently placed.  Once this was complete, the map had to be exported so it was visible to all users of the mapknitter site. The map I created on mapknitter is seen in Figure 1.


Figure 1: Aerial Imagery map created with MapKnitter (mapknitter.org)

The second technique was georeferencing with ArcMap.  Because there was such a plethora of images collected by the balloon, the class divided sections of the campus into groups to lighten the workload for all students.


I started a new map document then loaded data that would be beneficial to the process of georeferencing.  The data included a polygon feature class for my groups section and a CAD polygon feature class of the buildings on campus (Figure 2).  I used an imagery basemap provided by ESRI in the beginning of the process as a reference.

Figure 2- Group Section & Buildings feature classes

After this data was added the process of georeferencing could begin.  This process if not very complicated, but it is time consuming and must be done carefully.  Below are the steps necessary for georeferencing.

1.) Turn on the georeferencing toolbox (Figure 3)
Figure 4: ArcGIS Desktop 10.1 Georeferencing toolbar

2.) Click the "Control Points Tool"
3.) Zoom to the current image
4.) Click a point on the current image that can be easily referenced to the buildings feature class
5.) Zoom to the Group Section layer
4.) Click on the area that matches the point previously selected on the current image

The image will move to a new location using the georeferenced point; do this repeatedly for each image until the image is placed in the correct area.  This process is repeated for each image until an area is accurately represented on the map.

Zooming between layers is helpful because the aerial imagery is not spatially referenced and is located very far from the needed area.

The georeference control points can be edited using the "Control Points Table" (Figure 5).  The control points are labeled by a number and when clicked on, the control point will be highlighted on the map.  Editing mainly consists of deleting control points if it distorts the image or the image's location on the map.

Figure 5: Control Points Table

Results
Figure 6: Final mosaiced raster of the aerial images


Discussion
Although I was apprehensive to use ArcMap to mosaic the aerial imagery together, I believe ArcMap 10.1 produced a better result and it was easier to georeference the images in this technique.  It was also a good resource to use because you could go back and edit the control points.  This wasn't available in Mapknitter, so if a project was greatly distorted you had to delete the image and start over.

The images taken from the balloon are not at a constant altitude or angle.  This makes it hard to match the images perfectly and some of the areas are distorted because of this.  To avoid this problem as much as possible, the images overlapped each other in many areas.  This problem can be seen in the area of the walking bridge and Schofield Hall in the final map.

Sunday, April 7, 2013

Field Navigation IV


INTRODUCTION
Navigation in the field is incredibly important in field methods.  Accuracy in the field is dependent on the type of navigational resources available and can be skewed with the simplest miscalculation.  In the previous weeks, our class used different type of navigational resources to navigate through a newly acquired property for UW-Eau Claire, The Priory.  Maps, compasses and GPS units were used as navigational resources.  Students were put into groups of three and given a specific course to navigate.  Each group had to find waypoints in order to finish their course.  When the GPS units were used groups plotted points at the waypoints and a tracklog was used to note the course.  After we navigated the course in the field we used ArcGIS to import the GPS data and to create maps of our routes.

Each activity built on our knowledge of field collection.  The activities also introduced the students to other ways of navigating.  It was important for us to experience working in the field because we learned to overcome challenges that were presented by the weather, terrain and technology.

2.)This week we used the navigation maps from the previous exercise and applied our pace count to find waypoints at The Priory.  This straightforward exercise presented challenges due to the weather, terrain and lack of navigation technology.

3.) This week, we expanded on the navigation exercises of the previous weeks.  A GPS unit was used to navigate to waypoints without the use of a map or compass.  Students were provided a list of Lat/Long points by the professor for each waypoint.  Students activated the tracklog feature of the GPS unit in order to track their route throughout the activity.


4.)You have the class period to complete all 15 points from all three courses. The first group finished wins.  Make sure you use the punch on your cards at each flagged location.


METHODS


For the first weeks exercise only a map and compass were used to navigate The Priory.  Each student had to calculate their pace count before going in the field.  A pace count takes into account how many steps a person takes within a given distance.  This information allows a person to know how far they have traveled without the use of a GPS unit.  The distance for our pace count was 100 meters.  To determine my pace count, I walked at a normal pace counting every pace (every other step) for a pre-measured distance of 100 meters.  I repeated this process three times and took the average of the count-70 paces.  Knowing my individual pace count helped me to account for the distance I travel while navigating at the priory.

Two navigation maps were created for the first week's exercise.  The first map was an overview of the area (Figure 1), while the second was more precise and include topography (Figure 2).  Our professor supplied data included CAD drawings, aerial imagery and polygon feature classes.  Topographic data was also provided by the USGS.  The data was projected to NAD 1983 UTM Zone 15 North so a UTM grid could be applied to the maps.  A polygon feature class of the boundary was supplied by our professor as well as a point feature class of the waypoint locations.  This data helped us to reference our location in relation to the waypoints.
Figure 1- Overview navigation map


Figure 2- Navigation Map with 2 and 5 foot contours
When we reached The Priory on our first day of navigation,our professor provided a list of X and Y coordinates of the waypoints (Figure 3).  We used these coordinates to plot the points on our navigation map. We then used a compass to note the angle of direction on our map.  This information would be used in the field to better navigate the waypoint courses.  We also measured the distance in meters from one waypoint to the next so we could use our pace count in the field to determine our distance.


Figure 3-X and Y coordinates of waypoints provided by Joseph Hupy
Once in the field, we started at point 1A.  We used our compasses to find the correct angle of direction.  We sent one person out about 150 feet and aligned their position to the necessary angle (Destination).  One person stayed behind to make sure the angle of direction was followed (Angler).  The other person walked while using their pace count to the person who was aligned with the angle of direction (Runner).  We kept track of how many paces it took for the runner to reach the destination so we could determine how much further we had to travel to reach our waypoint.  We broke up the distance between two waypoints so we could send out the destination person to an area where they were still visible to make sure we kept the correct angle of direction.  This process was repeated over and over to navigate through the course.  Once we reached a way points, we punched a course card given to us by our professor with the stamp at each waypoint.

During the second navigation activity students were allowed to use a GPS unit and map to navigate the course.  To begin we had to find the starting point of our route, the location was indicated by the list of lat/long points given to us by our professor.  At the starting point, we activated the tracklogs on the GPS units.  We made sure to activate only when we reached the starting point so only our course was tracked.  From the starting point, we used the lat/long feature of the GPS unit to navigate to the first way point (Figure 4).  We observed the increase and decrease of the lat/longs on the GPS unit to determine which direction to travel.  This was done for all six waypoints on our course.  After we had found each waypoint, we traveled back to the starting point to complete the course.  Upon reaching this point, we turned off the tracklog.


Figure 4-Navigating with the GPS unit
Figure 5- Zac & Phil located a waypoint
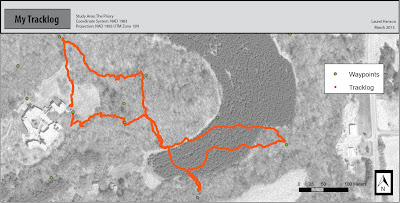
Using the DNR Garmin application, students uploaded their individual tracklogs onto a computer.  Through this program, the tracklog could be easily converted into a point shapefile.  The shapefile was then imported into the class geodatabase.  Once the data was imported, three maps were created.  One map showed the tracklogs for every student in the class (Figure 6).  Another map showed the tracklogs for my group (Figure 7) and another for my own tracklog (Figure 7).
Figure 6- Map of the tracklogs for each student in the class
Figure 7- Map of my group's tracklogs


Figure 8- Map of my individual tracklog

For the third activity, we used a GPS unit and map again to navigate to waypoints.  For this activity groups had to navigate to every waypoint, 15 in total.  We were also given paintball guns to add some excitement to the activity.    The same techniques were used as the previous week.  The same three maps were also created for this activity (Figure 9).

Figure 9-Week three maps: Class, Group and Individual Tracklogs


DISCUSSION
These activities taught me how different technologies can be used for navigation.  It is easy to assume the the highest techology is always best, but these activities showed me that it is possible to navigate accurately with simply a map and compass.

I also learned a lot about working together as a group through these activities.  Our group worked together very well, this helped our group to navigate efficiently.  One thing that did not work well for our group was using the pace count.  The pace count was difficult to use  because we measured our individual pace count on a flat surface with no obstacles before this exercise.  We found that our pace counts came up short for each waypoint in the field due to rough terrain and the amount of snow on the ground.


Technology does not always make navigating easier.  Although we were allowed to use a GPS unit to navigate in the last two weeks, it was not easier than the compass and map navigation.  It was somewhat difficult to determine the direction of travel using lat/long the the GPS and a group member had to be constantly watching the lat/long numbers to make sure we didn't stray off of our direction.  Even though it was more difficult to navigate with a GPS unit, it took less time to navigate using this technique.

The transformation from the GPS unit to a GIS shapefile caused the features to be somewhat skewed.  Waypoints did not fall exactly in the correct location and the tracklogs were somewhat inaccurate as well.  This is one deterrence that is unfortunate but can be fixed through editing in ArcGIS.

CONCLUSSION
All of the techniques that we used to navigate were important in their own way.  It is important to know not only how to use these technologies individually, but also how to use the technologies as a combination.  We used techniques that are not technologically advanced (map, compass) and technologies that were advanced (GPS units).  The activities showed the benefits and drawbacks of each technique.

Sunday, March 24, 2013

Field Navigation III


INTRODUCTION
This week, we expanded on the navigation exercises of the previous weeks.  A GPS unit was used to navigate to waypoints without the use of a map or compass.  Students were provided a list of Lat/Long points by the professor for each waypoint.  Students activated the tracklog feature of the GPS unit in order to track their route throughout the activity.

METHODS
To begin this activity, we had to find the starting point of our route, the location was indicated by the list of lat/long points given to us by our professor.  Our groups starting point was near the gazebo at the Priory.  At the starting point, we activated the tracklogs on the GPS units.  We made sure to activate only when we reached the starting point so only our course was tracked.  From the starting point, we used the lat/long feature of the GPS unit to navigate to the first way point (Figure 1).  We observed the increase and decrease of the lat/longs on the GPS unit to determine which direction to travel.  If we needed to go north, we would watch for the latitude number to increase; decrease for south.  To travel east we watched for the longitude number to increase; decrease to travel west.  This was done for all six waypoints on our course (Figures 2 & 3).  After we had found each waypoint, we traveled back to the starting point to complete the course.  Upon reaching this point, we turned off the tracklog.


Figure 1-Navigating with the GPS unit
Figure 2- Zac & Phil at the second waypoint


Figure 3- A waypoint in our course
Using the DNR Garmin application, students uploaded their individual tracklogs onto a computer.  Through this program, the tracklog could be easily converted into a point shapefile.  The shapefile was then imported into the class geodatabase.

Three maps were created for this activity; Class tracklogs (Figure 4), Group tracklogs (Figure 5) and individual tracklogs (Figure 6).

Figure 4- Map of the tracklogs for each student in the class

Figure 5- Map of my group's tracklogs

Figure 6- Map of my individual tracklog
DISCUSSION
Technology does not always make navigating easier.  Although we were allowed to use a GPS unit to navigate this week, it was not easier than the compass and map navigation.  It was somewhat difficult to determine the direction of travel using lat/long the the GPS and a group member had to be constantly watching the lat/long numbers to make sure we didn't stray off of our direction.  It was more difficult in my mind to navigate this week compared to last week, but it took our group less time to navigate using this weeks technique.

It is noticeable that the tracklog does not fit exactly with the waypoints.  This is because of the accuracy of a GPS unit and the tranformations from the GPS unit to a GIS shapefile.  This also skewed the starting and ending points of the course.  Even though our group walked to the starting points after the course was completed, the route is not "closed" according the the maps.

CONCLUSION
There are many techniques that can be used for navigation.  A map, compass or GPS unit are just a few of these techniques.  It is good to know how to use each of these individually as well as together.  A combination of these three techniques would allow for the must efficient and timely way to navigate.  GPS units are very accurate, but one must always observe the changes that may occur when transforming the data from GPS to a computer (GIS).  This can be avoided in some ways through a similar spatial reference for the GPS and the GIS.  If the data is still skewed, it can be manually edited in a GIS.


Monday, March 11, 2013

Field Navigation II

INTRODUCTION
This week we used the navigation maps from the previous exercise and applied our pace count to find waypoints at The Priory.  This straight forward exercise presented challenges due to the weather, terrain and lack of navigation technology.

METHODS
Before going out into the field our professor provided a list of X and Y coordinates of the waypoints (Figure 1).  We used these coordinates to plot the points on our navigation map (Figure 2).  We then used a compass to note the angle of direction on our map (Figures 3 and 4).  This information would be used in the field to better navigate the waypoint courses.  We also measured the distance in meters from one waypoint to the next.


Figure 1-X and Y coordinates of waypoints provided by Joseph Hupy
Figure 2- Waypoints plotted on navigation map


Figure 3- Angle of direction from point to point applied to navigation map
Figure 4- Zac plotting the angle of direction between waypoints on navigation map

We started at point 1A.  This was next to the dumpsters at the Priory.  We used our compasses to find the correct angle of direction.  We sent one person out about 150 feet and aligned their position to the necessary angle (Destination).  One person stayed behind to make sure the angle of direction was followed (Angler).  The other person walked while using their pace count to the person who was aligned with the angle of direction (Runner).  We kept track of how many paces it took for the runner to reach the destination so we could determine how much further we had to travel to reach our waypoint.  We broke up the distance between two waypoints so we could send out the destination person to an area where they were still visible to make sure we kept the correct angle of direction.  This process was repeated over and over to navigate through the course.  Once we reached a way points, we punched a course card given to us by our professor with the stamp at each waypoint.

DISCUSSION
Our group worked together very well and we each took turns being the destination, angler and runner.  We found it was easier for Phil and Zac to be the destination because in some areas I was too short so I couldn't travel far while staying visible.  The pace count was difficult to use in this exercise because we measured our individual pace count on a flat surface with no obstacles before this exercise.  We found that our pace counts came up short for each waypoint.  To overcome this, we kept our angle of direction and followed that direction until we found our waypoint.

We had to travel over a large, steep hill between points 4A and 3A.  Because of this, it was impossible to use our pace count.  We had navigated to 3 points before this section, so we had a good idea of how far we had to travel.  We estimated the distance we needed to travel and kept a very close eye on our angle of direction.

Another obstacle of this activity was the height difference between my group members and I.  I am about 6 inches shorter than both Phil and Zac, so I struggled to keep up with them because the snow was so deep in some places.  My group members understood why I was lagging behind them, so they slowed down for me. It is important while working in the field to stay and work together as a group not only for safety reasons, but also for accurate navigation.  The activity was also more fun because of the atmosphere we created as a group.

CONCLUSION
We found each waypoint quite easily using a compass, navigation map and pace count. The next activity is to navigate through the courses again, but without a navigation map or compass.  We will use a Garmin E-Trex GPS unit to find the waypoints and will track our log to see how precisely we can follow the path to the waypoints.

Sunday, March 3, 2013

Navigation Map I

INTRODUCTION
Navigation in the field is incredibly important in field methods.  Accuracy in the field is dependent on the type of navigational resources available and can be skewed with the simplest miscalculation.  In the upcoming weeks, our class will be navigating through and plotting waypoint locations at the Priory, a newly acquired property for UW-Eau Claire.  Before we can set out in the field, we had to create a navigation map and determine a pace count for our group.

METHODS
To navigate in the field, each person had to calculate their pace count.  A pace count takes into account how many steps a person takes within a given distance.  This information allows a person to know how far they have traveled without the use of a GPS unit.  The distance for our pace count was 100 meters.  To determine my pace count, I walked at a normal pace counting every pace (every other step) for a pre-measured distance of 100 meters.  I repeated this process three times and took the average of the count-70 paces.  Knowing my individual pace count will help me to account for the distance I travel while navigating at the priory.

We will use two navigation maps locate our positions while in the field.  The first map will be an overview of the area, while the second will be more precise and include topography.  The maps will be printed on 11 X 17 sized paper, so before we could begin, we had to change our paper setting to match.  Our professor provided a wealth of data in the form of a geodatabase to use in our maps.  The data included CAD drawings, aerial imagery and polygon feature classes.  Topographic data was also provided by the USGS.  Maps can hold a wealth of information, but too much can cause confusion for the map user.  This was a challenge in the creation of our navigation map.  Although we wanted as much information as possible, we also need to be able to easily read and use our map.

I used an aerial image of the study area (The Priory) as the background of my first map (Figure 1).  I applied a topographic line feature class of 5 foot contours from the USGS as the next layer of the map (Figure 2).  I negated the 2 foot contour lines of the CAD drawings for this map to avoid clutter.  This first map will be used for an overall locator, so precision wasn't the highest priority.  The next layer of the map was a polygon feature class showing the boundary of the waypoints in the study area (Figure 3).  This data was also provided in the geodatabase.  The rectanglur polygon feature class had to be projected to the NAD 1983, UTM Zone 15N to correspond to the other map layers.
Figure 1- Aerial image of the study area (The Priory- Eau Claire, WI)
Figure 2- Aerial image with 5 foot contours and labels
Figure 3- Waypoint boundary polygon

A UTM coordinate system grid was applied as the top-most layer of the map.  This grid can be created in ArcMap by choosing "Data Frame Properties"> "Grids" and creating a new grid (Figure 4).  The spatial reference of the grid had to be set to NAD 1983, UTM Zone 15N (Figure 5).  Other grid properties were customized for visual necessities and units of measurement (Figure 6).  Figure 7 shows the UTM grid that was applied to the first map.

Figure 4- Creating a new UTM grid
Figure 5- Grid units
Figure 6- UTM coordinate system spatial reference
Figure 7- Newly created UTM grid with 50 meter units
 Once the map and UTM grid was created, other pertinent information was applied.  This information included a north arrow, scale bar, the projection and coordinate system of the data and data sources.  Figure 8 shows the final product of the first overview navigation map.
Figure 8- Overview navigation map
The second navigation map was created to have more precise topographic data.  The same data was used as in the first map, but I added a CAD drawing provided by the professor.  The CAD drawing consisted of 2 foot contour lines.  This was the "bottom-most" layer of the map and the same 5 foot contour data layer was applied as the next layer (Figure 9).  The symbology of this map was critical to ensure the visibility of both the 2 foot and 5 foot contours lines.  The 5 foot contour line data was labeled as a reference to the elevation.

Figure 9- 2 foot contour CAD drawing with 5 foot contour data layer
After applying both contour data files, the polygon of the waypoint boundary was again placed on the map (Figure 10).  The UTM grid was applied once again as well with the exact parameters as the first navigation map (Figure 11).  The same reference data was also applied including the projection, coordinate system, study area, data sources, north arrow and scale bar.  Figure 12 shows the second navigation map for more precise topographic representation.  The aerial imagery was not used for this map so the contour lines would be more easily visible.
Figure 10- Boundary polygon with contour data

Figure 11- UTM grid with 50 meter units
Figure 12- Navigation Map with 2 and 5 foot contours
DISCUSSION
Although the process of creating navigation maps seems quite simple, the importance came from the application of data.  The maps needed to present all necessary information, but ease of legibility was also critical.  By using two maps this asset could be maintained.  Each person in our group of three created their own two navigation maps and we voted on the best maps to use in the field.  We chose Zac Womeldorf's two foot contour map (Figure 13) and Phil Glodowski's aerial locator map (Figure 14).
Figure 13- Zac Womeldorf's 2 foot contour map

Figure 14- Phil Glodwoski's Aerial locator map

CONCLUSSION
Knowing how to find data and knowing what the data represents is critical to map creation.  Aerial imagery can be found using NAIP imagery or Google imagery.  The USGS hold a wealth of topographic data, but it can also be found from other sources like the Wisconsin Department of Natural Resources.  GIS data is available from numerous sources, but it is best practice to use data that complies with National Map Accuracy Standards.  These standards ensure that the data creator, data lineage, projection and other pertinent information are provided with the data.

It is important to know how to navigate using a pace count and how to create a navigation map because these techniques do not require a high level of technology and they can be used in a variety of data collection methods.  The maps will help us to locate our position at The Priory and to navigate while collecting waypoint data.  They will also serve as a base for the creation of our next maps that will include waypoint data points.